Visualizations
Total Airfare
Unsurprisingly, the total money spent on airfare rose steadily over time. Growth was stagnant, however, from 2014 to 2017.
Total Frequencies by Year
In terms of flight volumes, the most popular times to fly during the year are early summer and the winter holiday season. January through March are the slowest times of year.
Flight volumes have risen steadily over the study period, but unlike total receipts from airfare, growth continued between 2014 and 2017.
Departures by Destination State
The vast majority of flights are concentrated in a minority of states.
Departures by Origin State
Compared to the beginning of the decade, flights are spread relatively more evenly among the states (except for California).
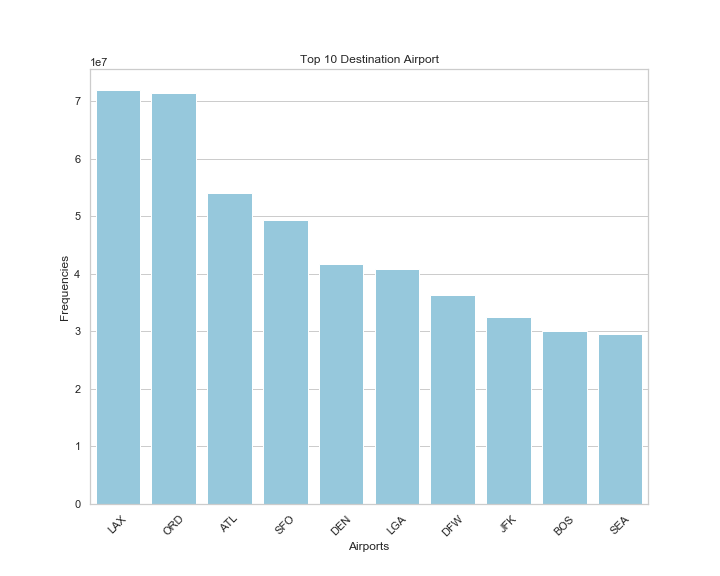
Top 10 Destination Airports
Each of the top 10 destination airports are major hubs.
Flights by Top 5 Carriers
Delta began and ended the decade as the airline operating the greatest number of flights. Note that the sudden increase in American Airlines flight volumes in 2014 coincides with the airline’s merger with US Airways.
OD Volumes
Explore the flight volumes between Origin and Destination pairs with the map below.
Ticket Price vs. Flight Distance
This scatterplot shows the relationship between Ticket Price, our dependent variable, and Flight Distance, one of the independent variables in our model.
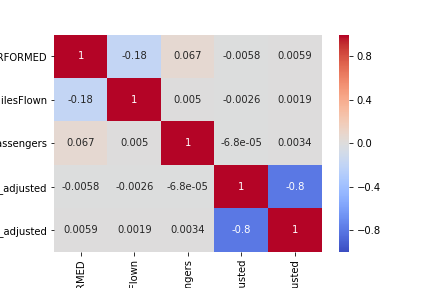
Correlation Matrix for the Model
Below is the correlation matrix for the continuous variables in our model. Other than fuel price and GDP, our explanatory variables did not have much collinearity.
Final Model Prediction Explorer
The widget below allows you to explore the outputs and errors from our model across specific OD pairs and years.
Note that we struggled to embed this properly, but it can be viewed as a standalone file by downloading this link.
Percent Error by Price
Our model had large errors and needs additional tuning. It performed especially poorly on lower cost tickets.